Tracker Coordinate Measurement Improvement in the Tracker Analysis
The y coordinate provides better accuracy by design, in which the readout strips have much smaller pitch compared to the strip pitch in the x coordinate. We present the improvement in the accuracy of determination of y-coordinate, which is the most important for the determination of momentum (or rigidity).
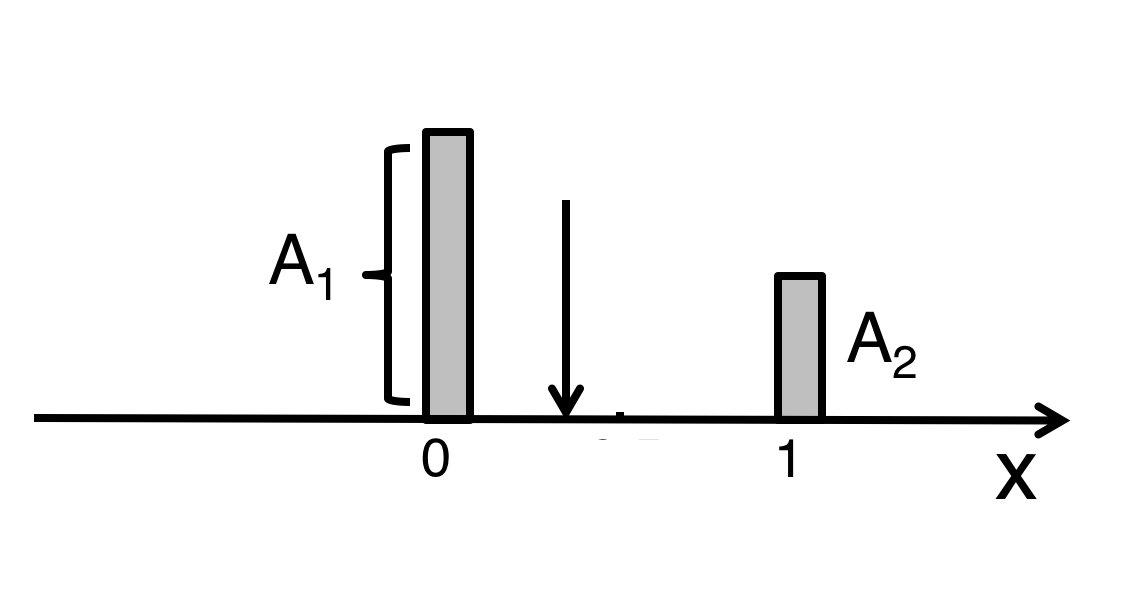
When a charged particle crosses a layer of the silicon tracker, its coordinate is determined by taking the ratio between the signals induced on the two strips between which the particle passed (see Figure 1).
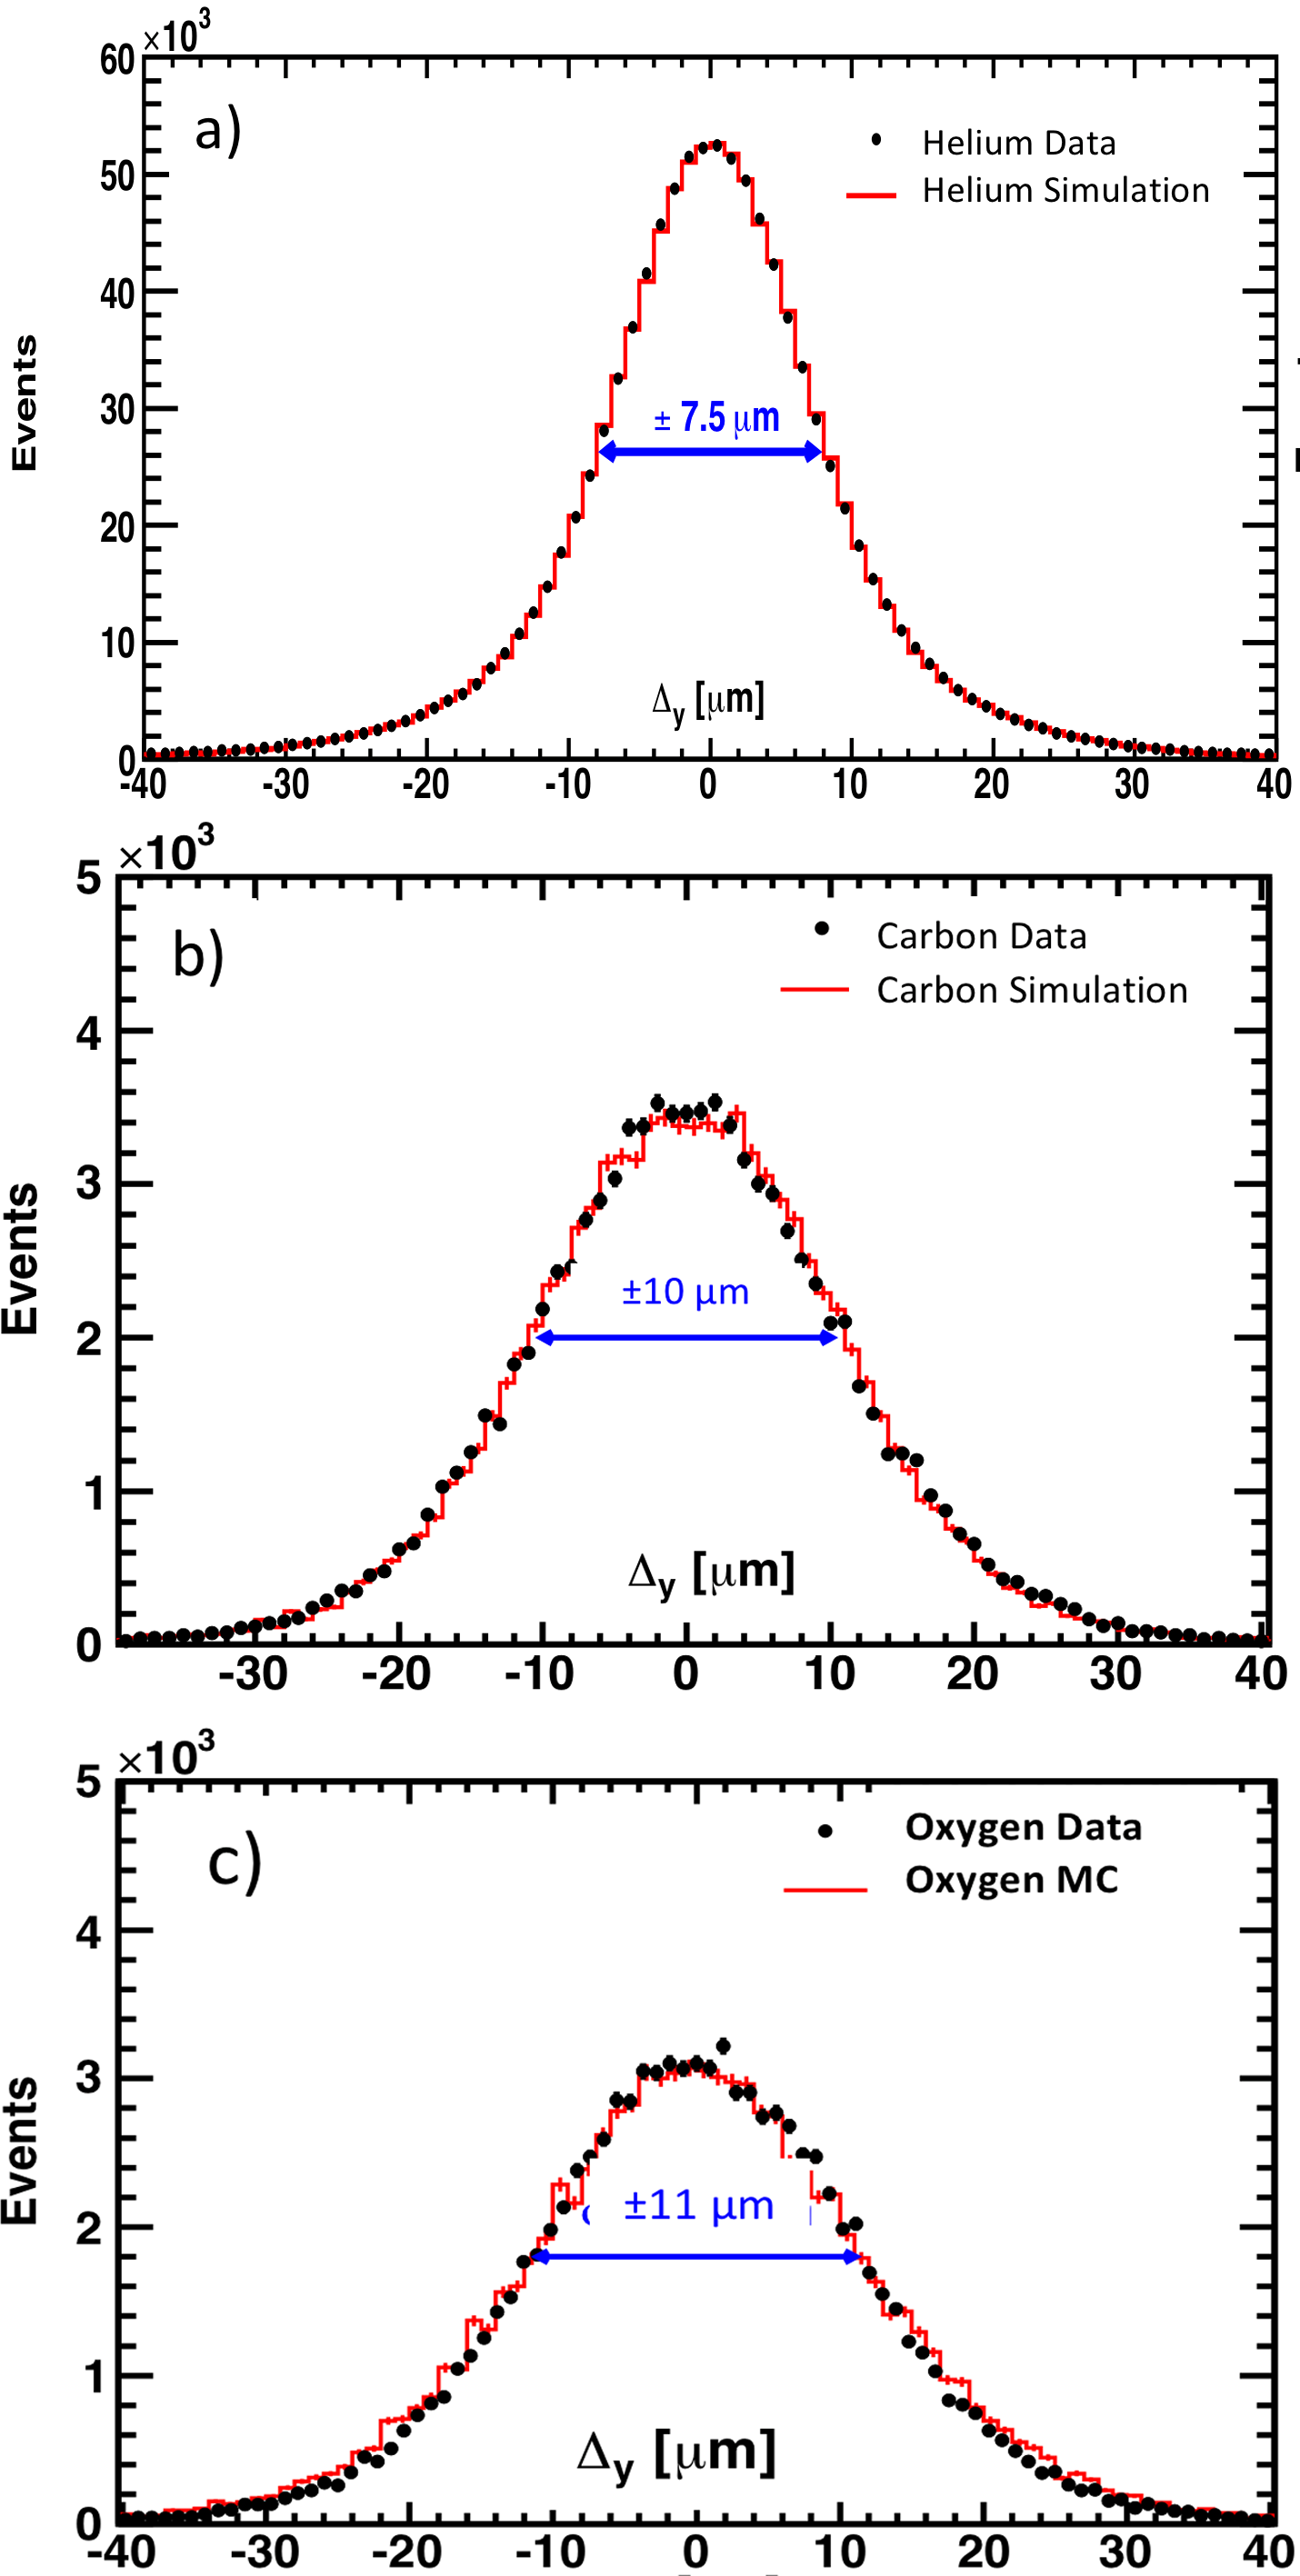
The amplitude of the induced signals should be proportional to $Z^2$. For $Z>3$ the amplitude $A_1$ starts to become non-linear, which causes resolution degradation. This effect is illustrated in Figure 2, where the spatial resolution for helium is compared with the resolutions for carbon and oxygen.
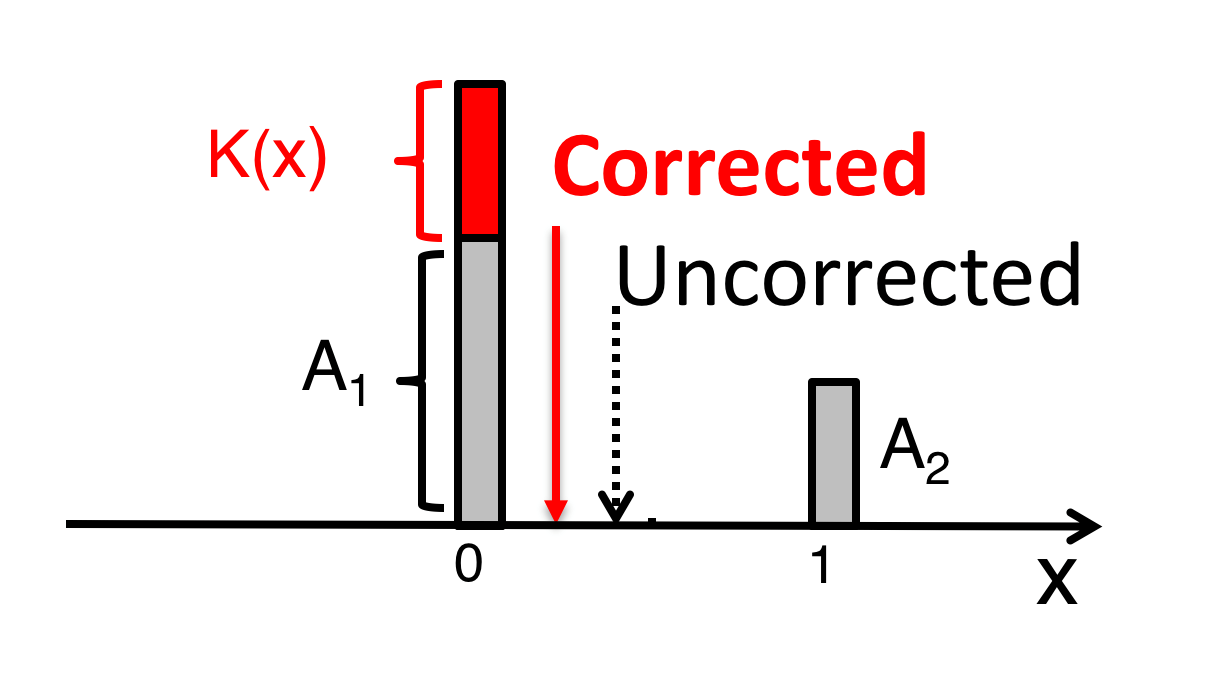
We have developed an optimal way to correct for the non-linear effect. For this we need to identify a function $K(x$) which will restore the linearity of the amplitudes by taking into account amplitudes A1, A2 and the corrected position
$$ x=1/(1+(A_{1}+K(x))/A_{2}) \tag{1} $$
This is illustrated in Figure 3.
This work is published in [G. Ambrosi, V. Choutko, C. Delgado, A. Oliva, Q. Yan, and Y. Li, Nucl. Instrum. Methods Phys. Res., Sect. A 869, 29 (2017)].
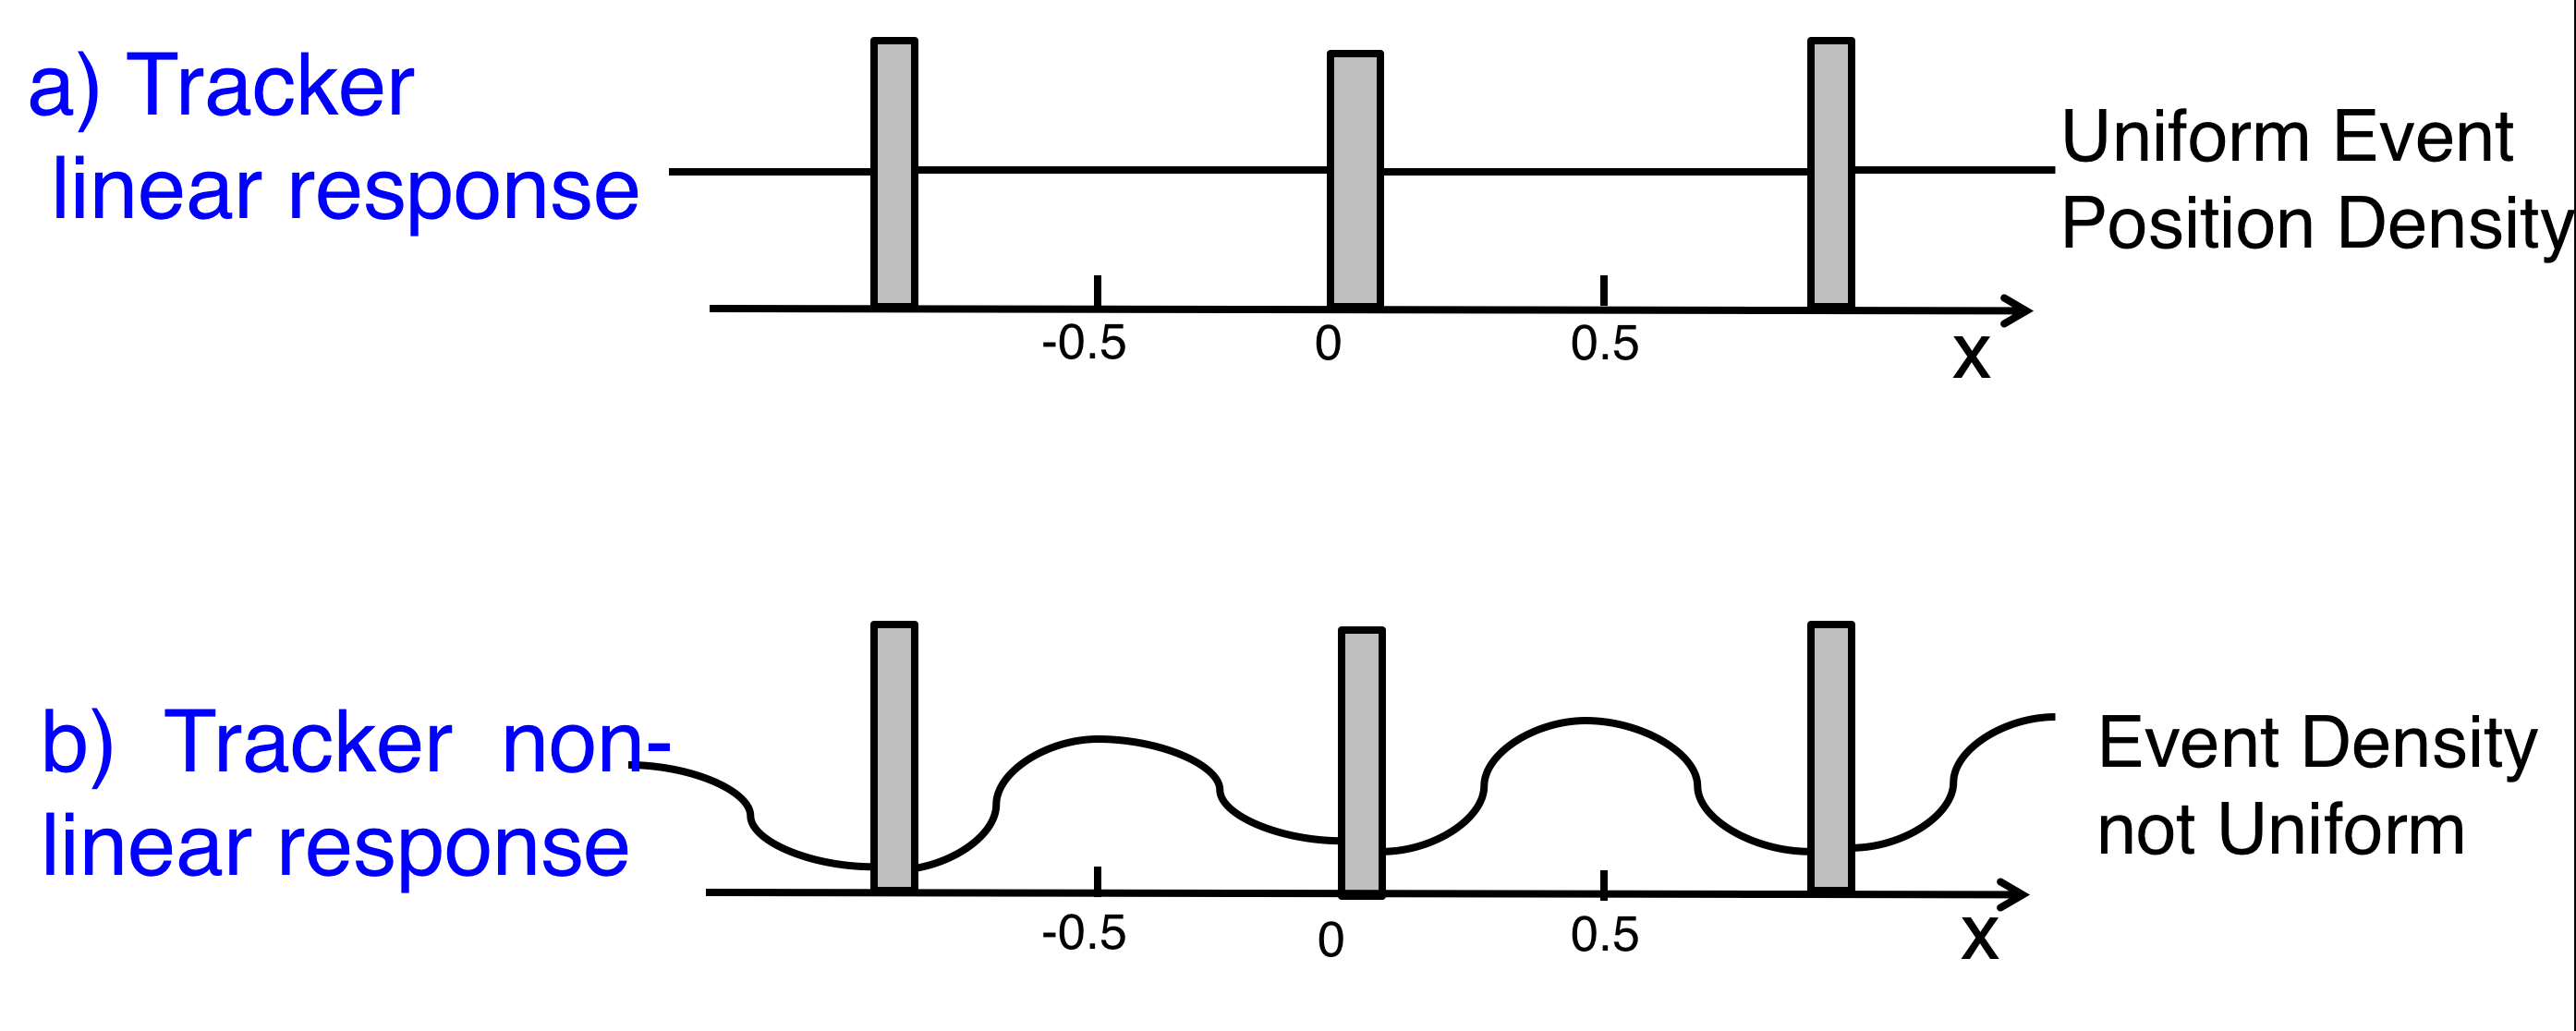
To determine $K(x)$, we used the fact that cosmic rays are uniform and isotropic, so for an ideal tracker, without nonlinearity, we should see a uniform event position density (see Figure 4a), while in the non-linear case the event density is distorted (see Figure 4b).
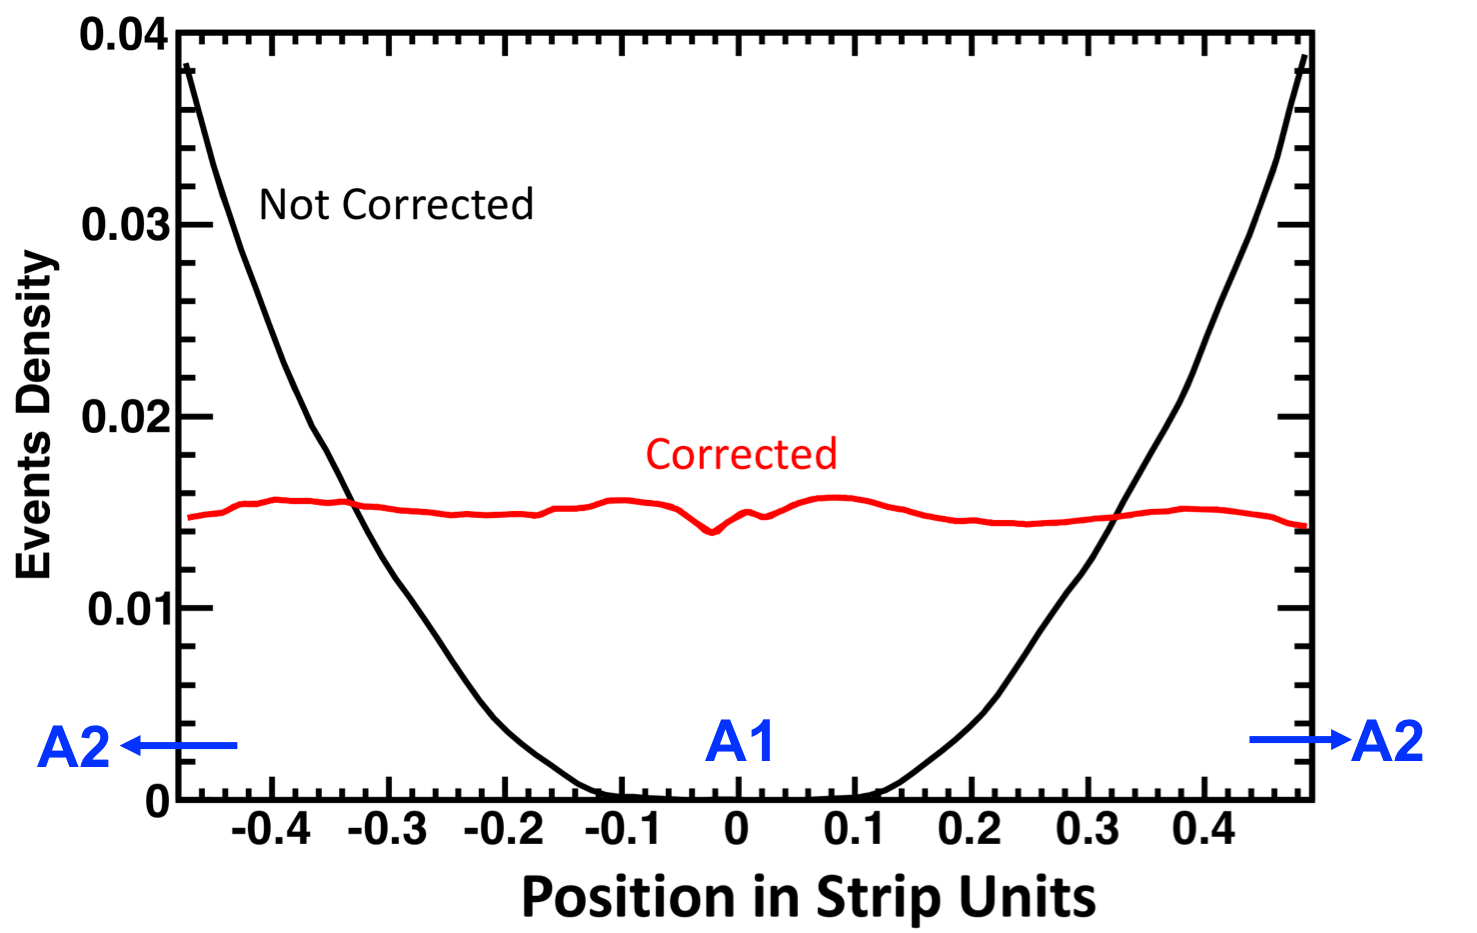
The function $K(x)$ was found to be different for different $|Z|$. Figure 5 shows the event density distribution for carbon nuclei before and after correction.
This method improved the position resolution by a factor of 2 for carbon (see Figure 6) and more than a factor of 2 for heavier nuclei.
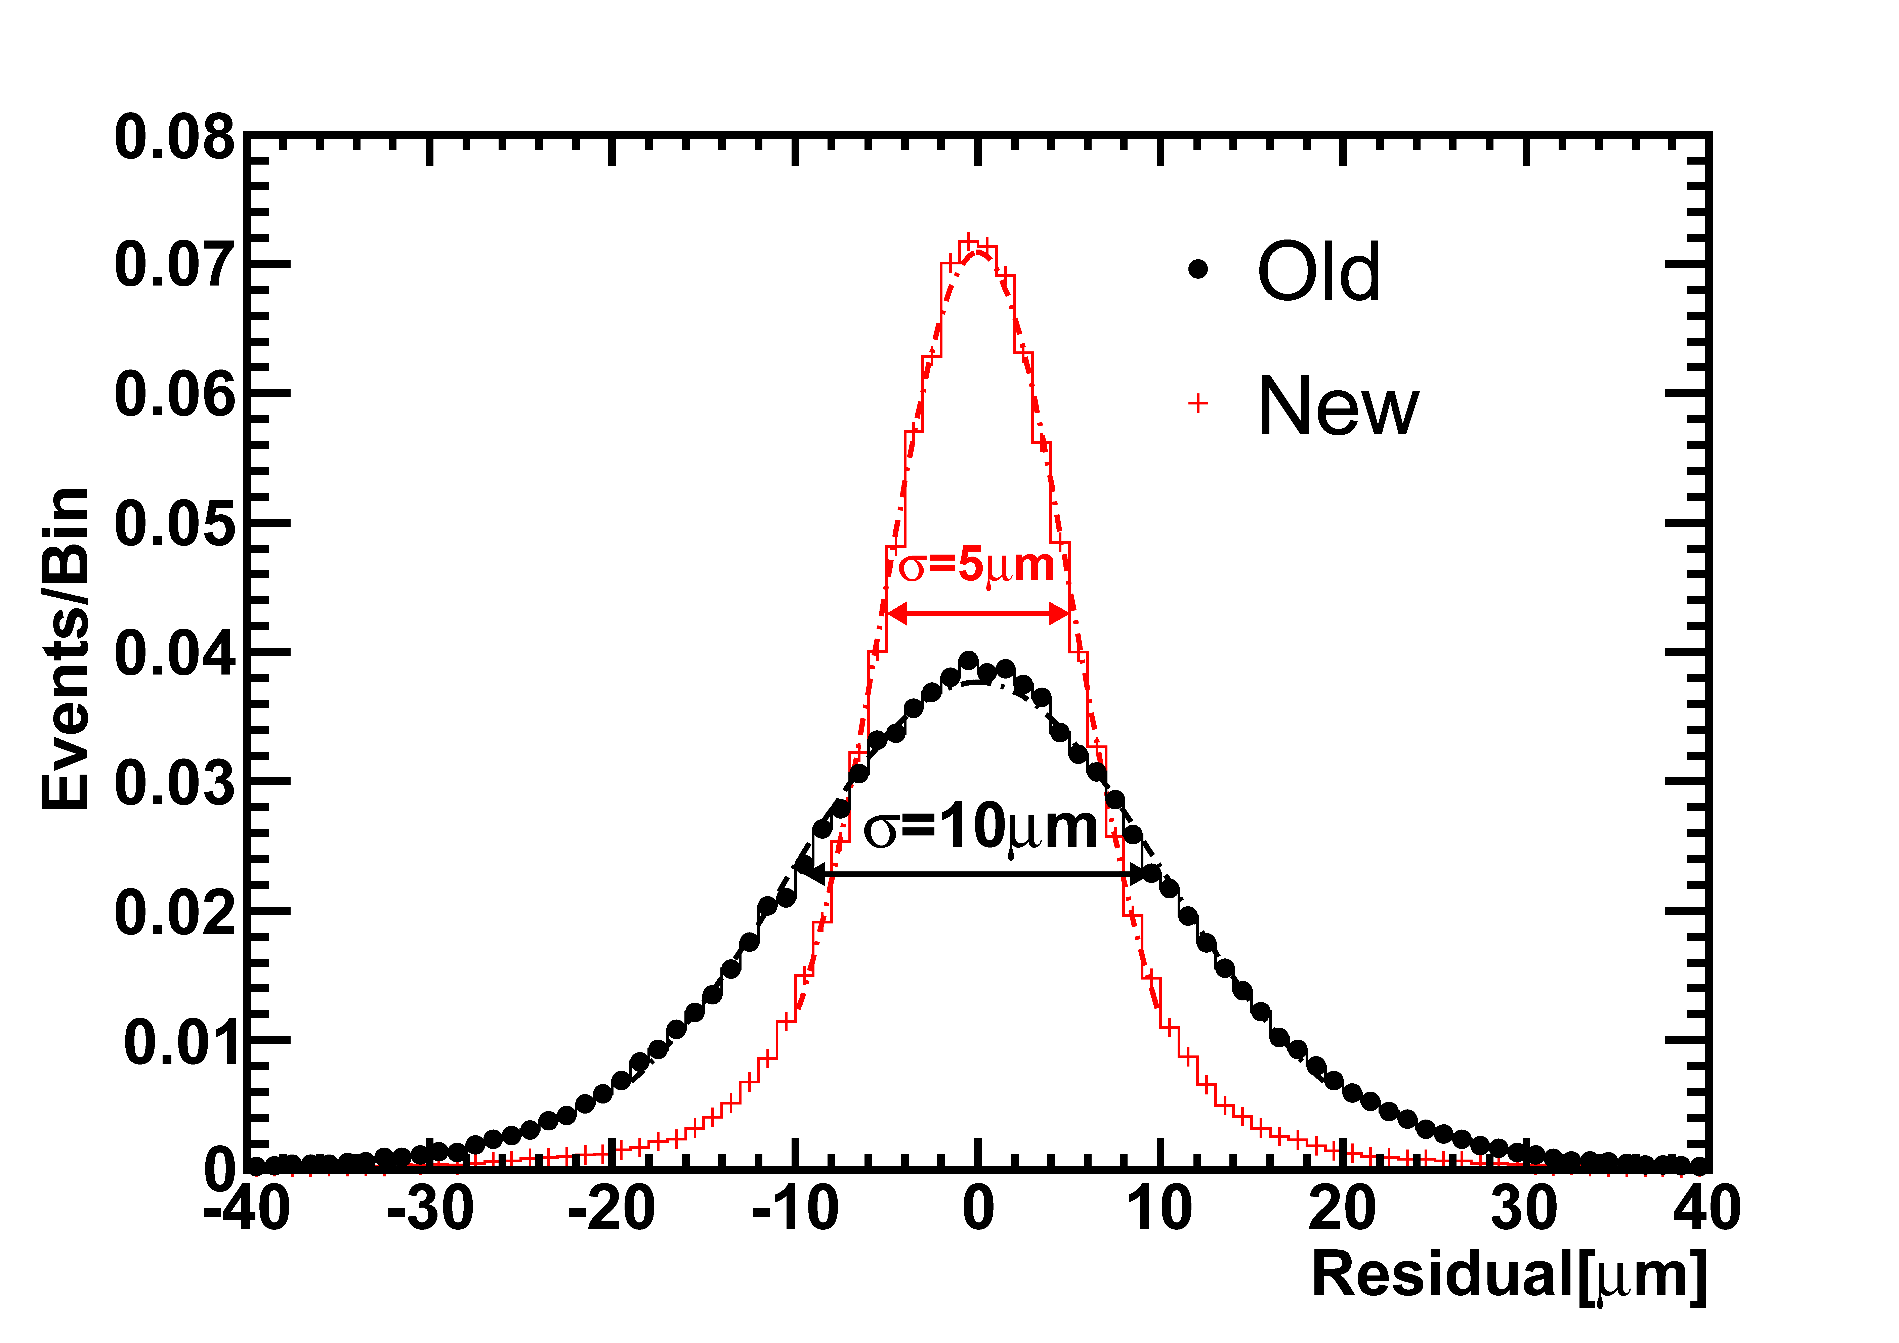
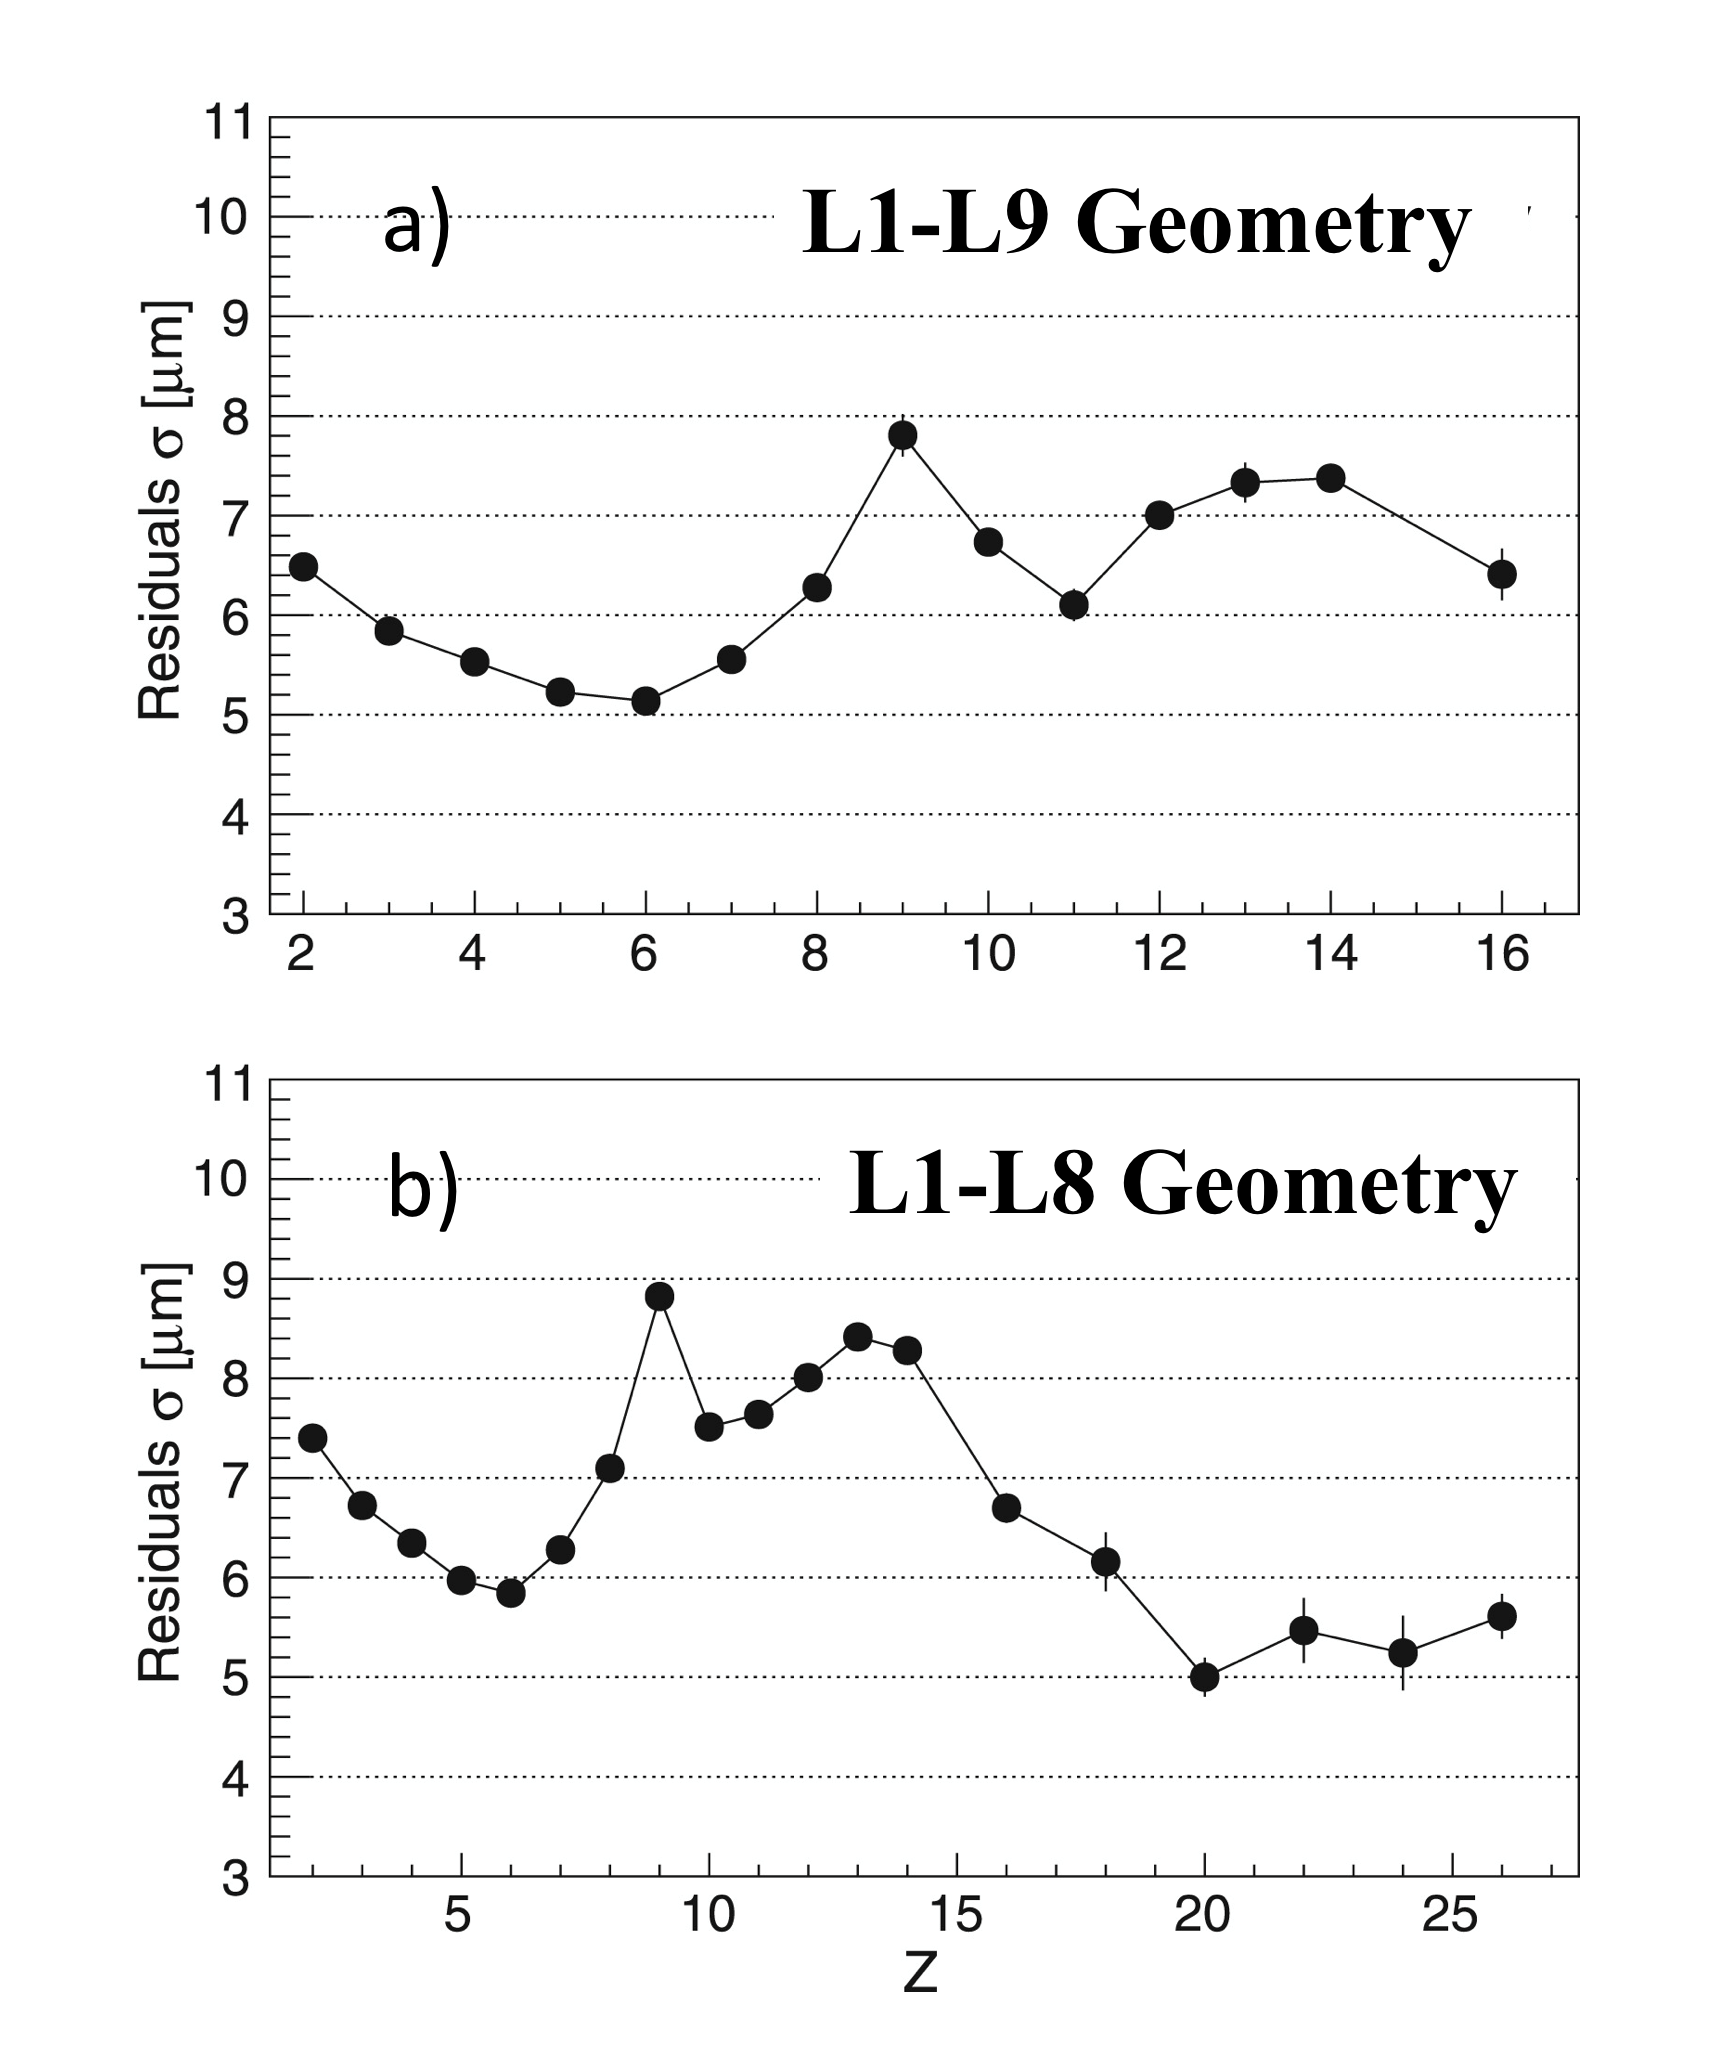
Figure 7 shows the coordinate accuracy for nuclei from $Z=2$ to $Z=26$ using the new analysis technique. Note that, due to the design of the tracker readout amplifier, the maximum non-linearity occurs for $Z\sim9$. This leads to the coordinate accuracy as a function of $Z$ shown in Figure 7.
